RFQ Dashboard
The dashboard is the landing page of the RFQ Management section. It provides a summary of your activity: key performance indicators (KPIs), list of your requests for quotation and analysis charts.
Dashboard Content
KPIs
A period selector located just above the KPIs allows you to filter indicators for the desired date range.
Key indicators are displayed at the top of the page, giving you an immediate overview of your RFQ activity: number of RFQs, values, conversion rates, etc.
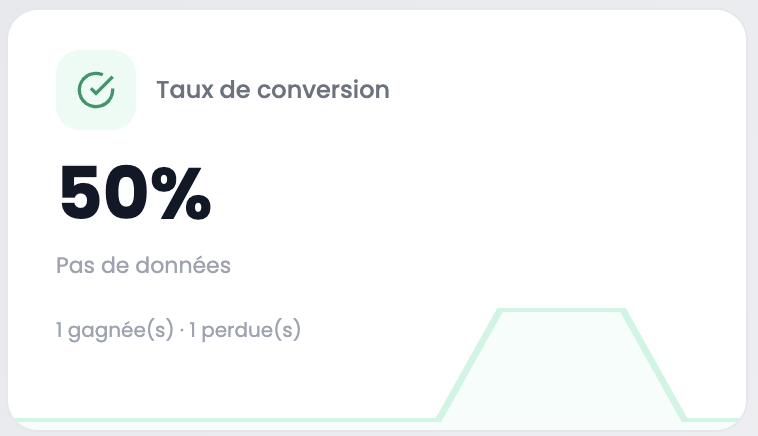
Each KPI card displays the main value and, in the background, the trend curve over the selected period.
RFQ List
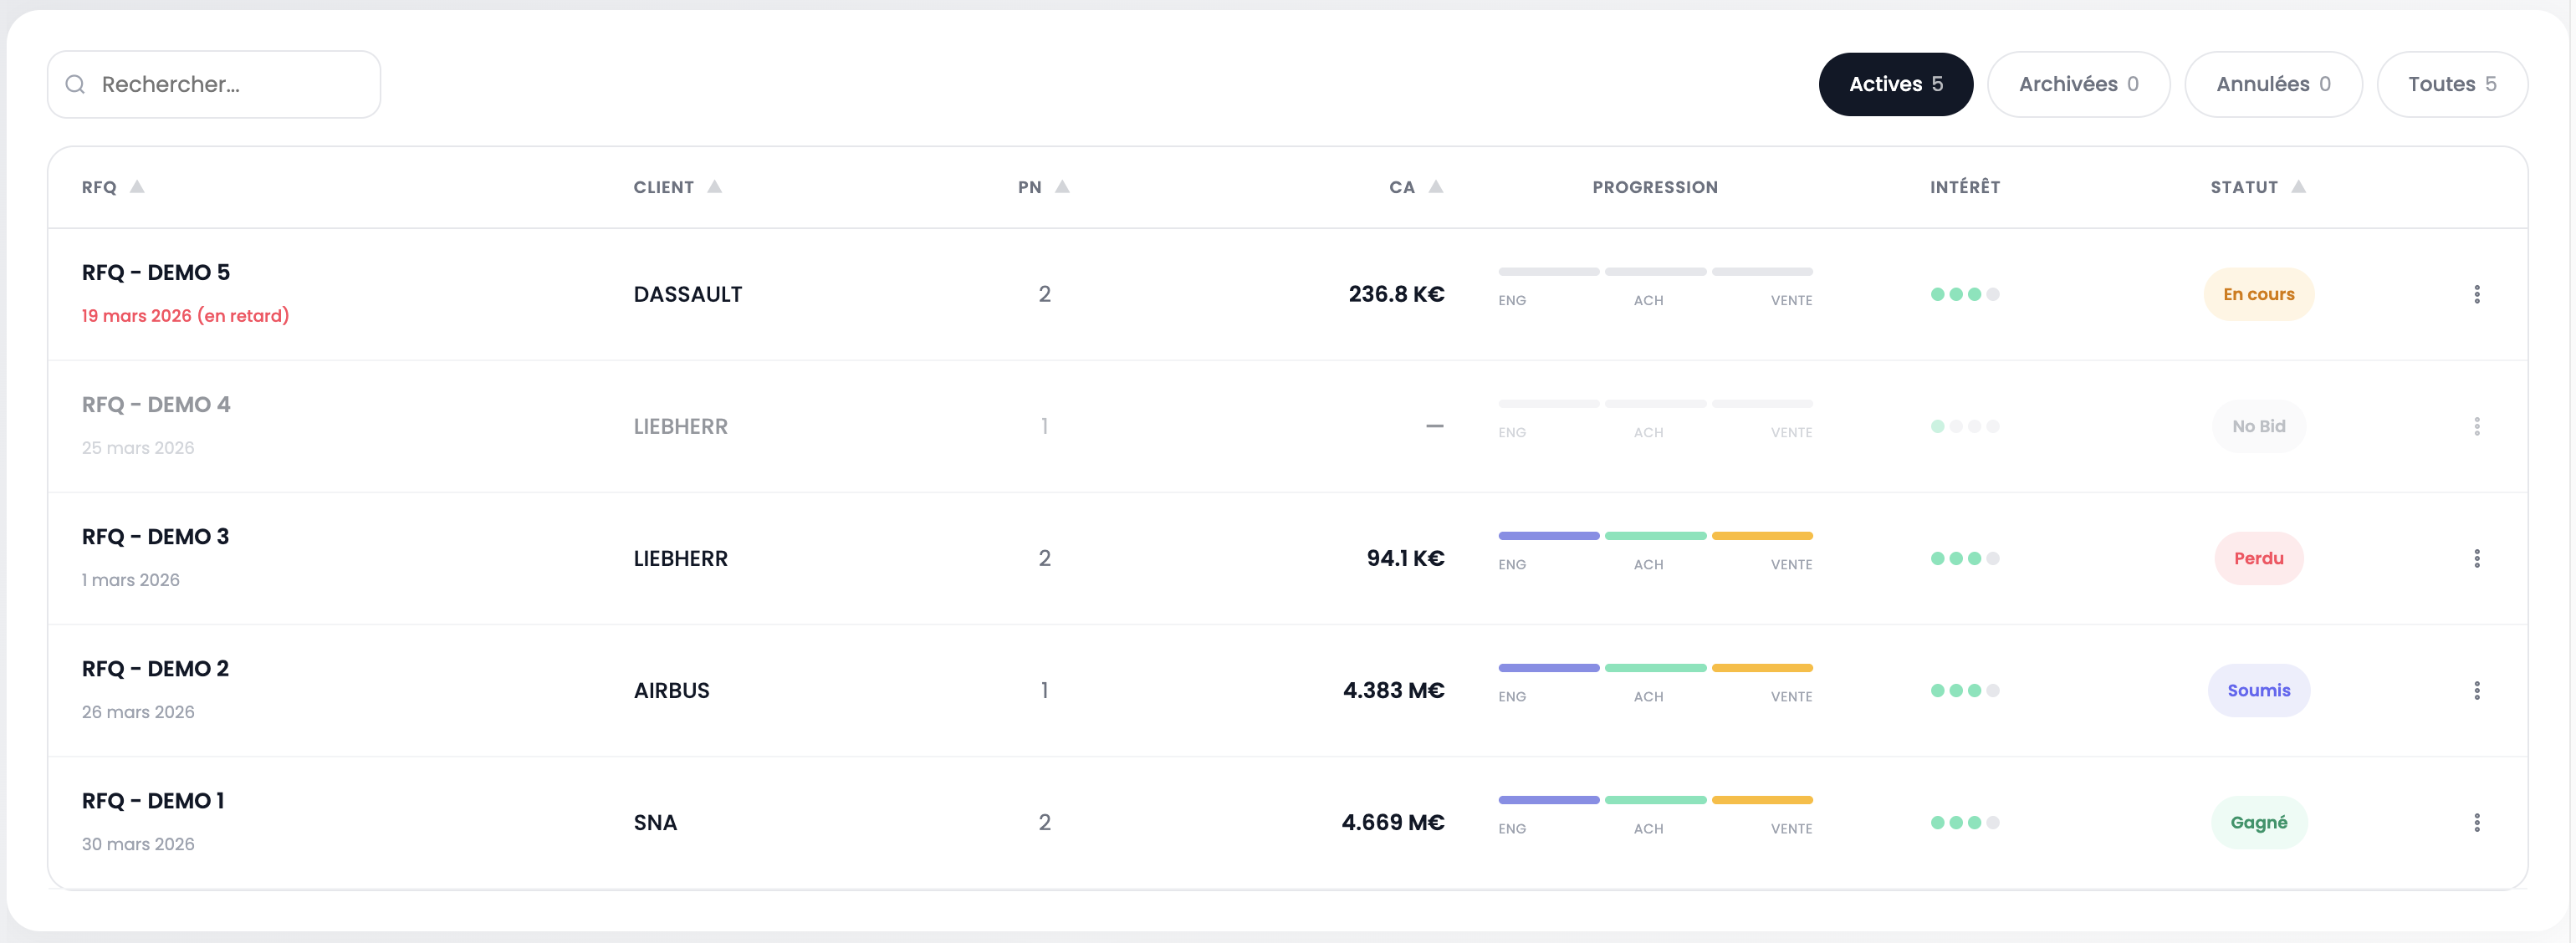
The central table lists all RFQs. Each row displays the RFQ name, customer, number of parts (PN), revenue (CA), progress per step (ENG, PUR, SALES), interest level and status.
Search — use the search field at the top left to filter RFQs by name, customer or reference.
Filter by status — the buttons at the top right allow you to filter RFQs by status:
| Filter | Description |
|---|---|
| Active | RFQs currently being processed |
| Archived | Closed and archived RFQs |
| Cancelled | Cancelled RFQs |
| All | Displays all RFQs |
The ⋮ button on the right of each row provides access to additional actions (archive, cancel, etc.).
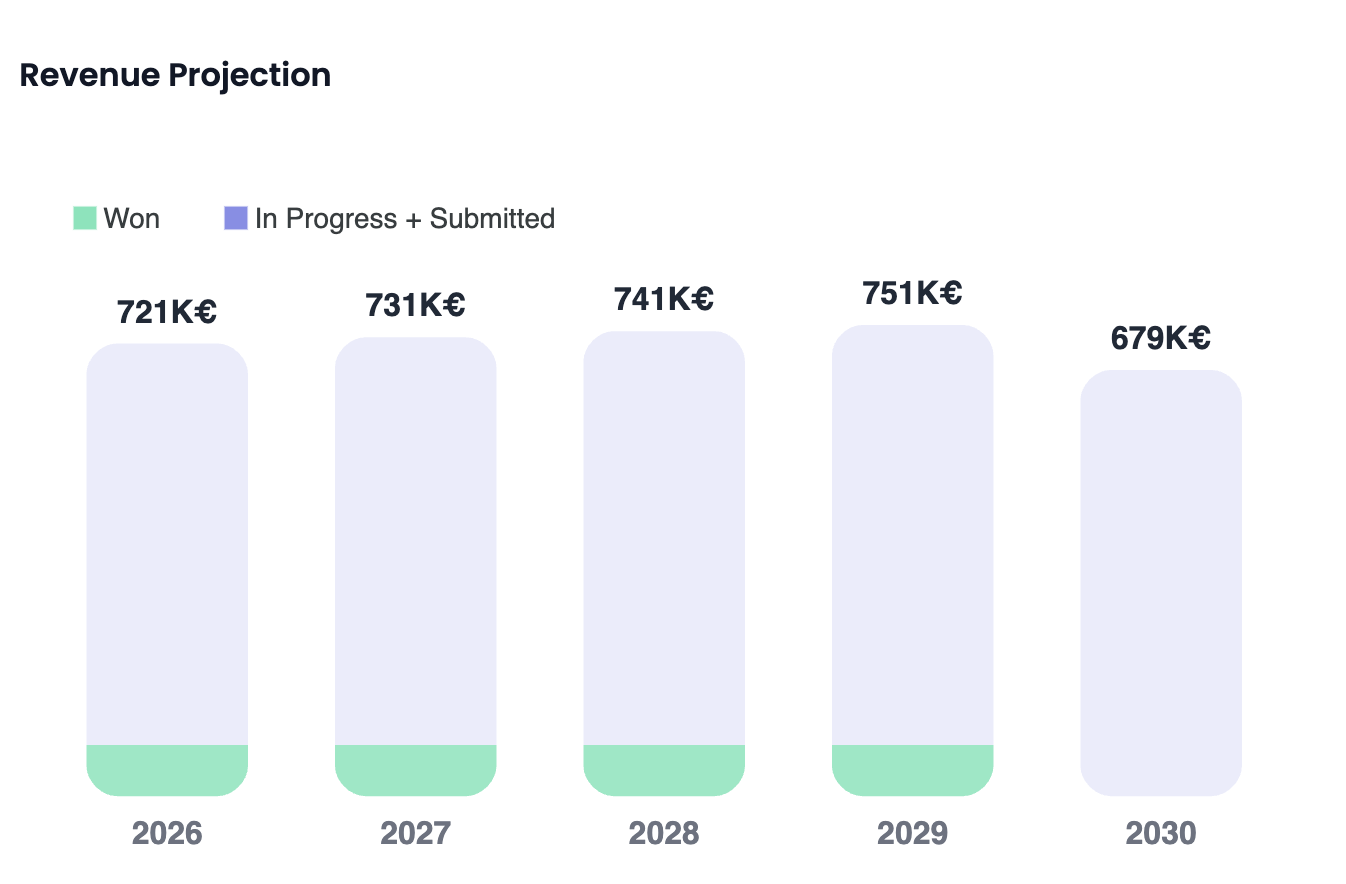
Charts
The charts at the bottom of the page allow you to visually analyze the evolution of your RFQ activity over the desired period.
Tip
Each chart has an interactive legend. Click on a legend item to show or hide the corresponding data series. This allows you to easily compare the data that matters to you.
Available Actions
In the top right corner of the dashboard, three actions are available:
| Action | Description |
|---|---|
| Currency | Select the display currency for KPIs and charts (EUR, USD, CAD) |
| Export KPIs | Download the performance indicators in an exportable format |
| Add RFQ | Create a new request for quotation |
Next Step
Click Add RFQ to create your first request for quotation.